One reason we have been trying for decades to “fix poverty” in International Development without success is the lack of rigor involved in studying past interventions. Having a basic understanding of “power” would help. The number of subjects involved in a program affects whether any future evaluation of that program will be able to learn from it. Everyone has heard of a t-test, and you can always run a t-test on data after the fact, but you can’t do anything about increasing your sample size afterwards.
That is why we should be teaching about “power analysis” first – it is the most important 5 minute calculation everyone should do BEFORE they start.
Statistical Power
Power is a measure of how likely an experiment is to show a difference, if a difference is there to be found. Power is measured as a number between 0 and 1 but usually spoken about in whole numbers from 0 to 100.
A rule of thumb – that will never raise questions among real statisticians if you follow it – is to design a study with a power of eighty (AKA 0.80) with an alpha (used for the tests that yield p-values) of 0.05.
power = 0.80
alpha = 0.05
If you use these two rules, you have a 4 in 5 chance of seeing a difference if a difference exists between your treatment and your control (power 0.80). And there is only a 1 in 20 chance that you will measure a difference when none really existed (p-value 0.05).
A power analysis will dictate what minimum sample size an experiment will need. There is even a brief 4-page power primer that allows you to look up what sample size you will need for any kind of experiment, so that the math-illiterates have no excuses.
For example, on the table below, if you are comparing the average number of grants an organization gets in a year between groups of NGOs, and you are looking for a “medium” effect…
Small effect : treatment 10% larger/smaller than control group
Medium effect : treatment 50% larger/smaller than control group
Large effect : treatment 80% larger/smaller than control group
… then you would need a sample size of 64 organizations in the control group and 64 different organizations in your treatment group, from the table below (look in Row #1 – mean difference).

The calculations are quite simple. Intuitively, power depends on two things:
- What is the smallest meaningful difference you are looking for?
- How much variability is there in the thing you are measuring?
If you prefer an interactive calculator to a table, here is one:
![]()
In spite of the straightforward way to answer this extremely important question, most fields are full of underpowered findings:
- 100 data-based studies exploring the effectiveness of rehabilitation procedures had a median power of 0.26 to detect “medium” effect sizes: http://www.ncbi.nlm.nih.gov/pubmed/2331338
- 85 papers in British Journal of Genetic Practice had a median power of 0.71: http://fampra.oxfordjournals.org/content/14/4/324.full.pdf
- 49 papers in Neuroscience had inadequate power, as shown in this histogram: http://www.nature.com/nrn/journal/v14/n5/fig_tab/nrn3475_F3.html

- A meta analysis of 77,237 studies published in reputable peer reviewed journals shows that most research does not have enough power to see differences when they would have been seen in a more powerful experiment design: http://www.plosone.org/article/info:doi/10.1371/journal.pone.0059202

- Cohen points out in his power primer (linked above) that the average power in all published studies in the 1960 volume of Journal of Abnormal and Social Psychology was only 0.48. This means that researchers were doing twice as much work, since they had only a 50/50 chance of seeing a difference after running the experiment.
Another way to think about it is that social science has been doing twice as many experiments as needed, spending at least twice as much money as needed, in order to learn about humanity. When power is 0.5 instead of 0.8, half our efforts are wasted, even when asking the right questions.
How to fix underpowered research
Fortunately, Statistician Frank L. Schmidt provides a rather simple and elegant way to combine all of these smaller experiments to formulate robust (same results across contexts) and reproducible (across time) conclusions.
Detecting correcting lies that data tell (Frank Schmidt)
The “trick” is that even poorly conducted research can point us to the true value (for the population) when you pool enough of these results together. Each result has a certain error (the difference between what you observed and the typical value for the population), and these erroneous results fall about the mean, which is the average of all the experiments, after correcting for sample size errors (smaller samples are less trusted than large ones). Graphically, it looks like this:

The bold and light gray boxes below show how the frequency histogram of the combined results form a bell curve. Note that:
- When you eliminate or include the lower power studies, you see a similar bell curve.
- The range (error) in the studies with more power, shown as bold boxes, is lower, but the “bell curve” shape is easier to see if you have more studies, regardless of their power.
- The peak of the bell curves is about the same in both cases.
- There is more inter-study agreement among the studies with higher power.
So when I say the future is about “big data” and quasi-unstructured learning, I mean that we will learn more when we keep more data, even the “bad” data. Based on the above cited meta analyses, it is a conservative estimate that researchers have thrown out half of all human knowledge about social issues because it appeared to not show any significant treatment effects (i.e. meaningful differences), and therefore were never published. Had we archived this data in spite of its apparent uselessness, we would actually know a lot more about what works, learned more with fewer resources, and achieved more statistical rigor at a meta-analysis level than was imagined possible at the time.
Stop throwing away your data!

Learn how to extract meaning from it by sharing it with others.
This will also be important for evolving solutions.
Postscript
Chris Blattman wrote a great piece on how we’re missing the boat on experimental rigor.
The latest thing that got me thinking in this vein is an amazing new paper by Alwyn Young. The brave masochist spent three years re-analyzing more than 50 experiments published in several major economics journals, and argues that more than half the regressions that claim statistically significant results don’t actually have them.
Might I suggest that if half the peer-reviewed published crap is statistically underpowered, and half these papers are hiding in a sea of statistical abuses, that we should fix the power problem first. This can be done by doing a lot of underpowered but comparable experiments across contexts to get “meta-power.” Then, amazingly, the generalizability problem will also be fixed. That’s math for ya.
Update: Is it fair to say that most social programmes don’t work?
From: https://80000hours.org/articles/effective-social-program/
- Education: Of the 90 interventions evaluated in RCTs commissioned by the Institute of Education Sciences (IES) since 2002, approximately 90% were found to have weak or no positive effects.
- Business: Of 13,000 RCTs of new products/strategies conducted by Google and Microsoft, 80- 90% have reportedly found no significant effects.
- Medicine: Reviews have found that 50-80% of positive results in initial (“phase II”) clinical studies are overturned in subsequent, more definitive RCTs (“phase III”).
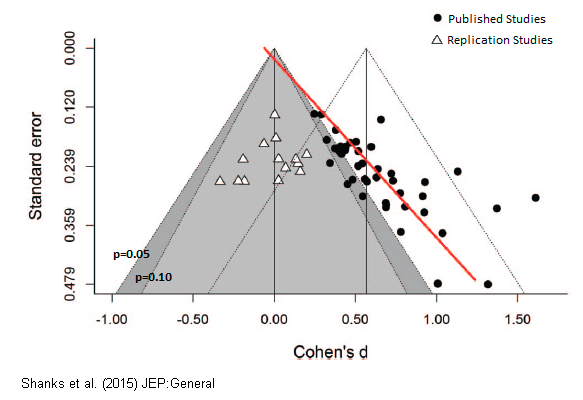
When you take a “good study” and replicate it, you don’t often get the same strong effect the second time. This happens when the statistical power is too low. And the data shows it is a real problem:
The argument for an evolution approach instead of a RCT is there:
- “70-80% of interventions (aggregated up into things like “bed nets”, “deworming”, etc., not individual projects) have at least one positive significant outcome if aggregated using random-effects meta-analysis.”
- “The current pace of RCT testing is far too slow to build a meaningful number of proven interventions to address our major social problems.”
- “The more studies we combine, the higher the chance of a positive effect.”
The way forward is not to throw out data, but to combine it and find ways for learning to happen at a “hive level” instead of on a case-by-case basis.
Post-postscript
Prefer to listen to this story? Check out Planet Money’s The Experiment Experiment episode: https://www.npr.org/sections/money/2018/03/07/591213302/episode-677-the-experiment-experiment

4 thoughts on “Fixing the Statistical Power Problem for International Development”