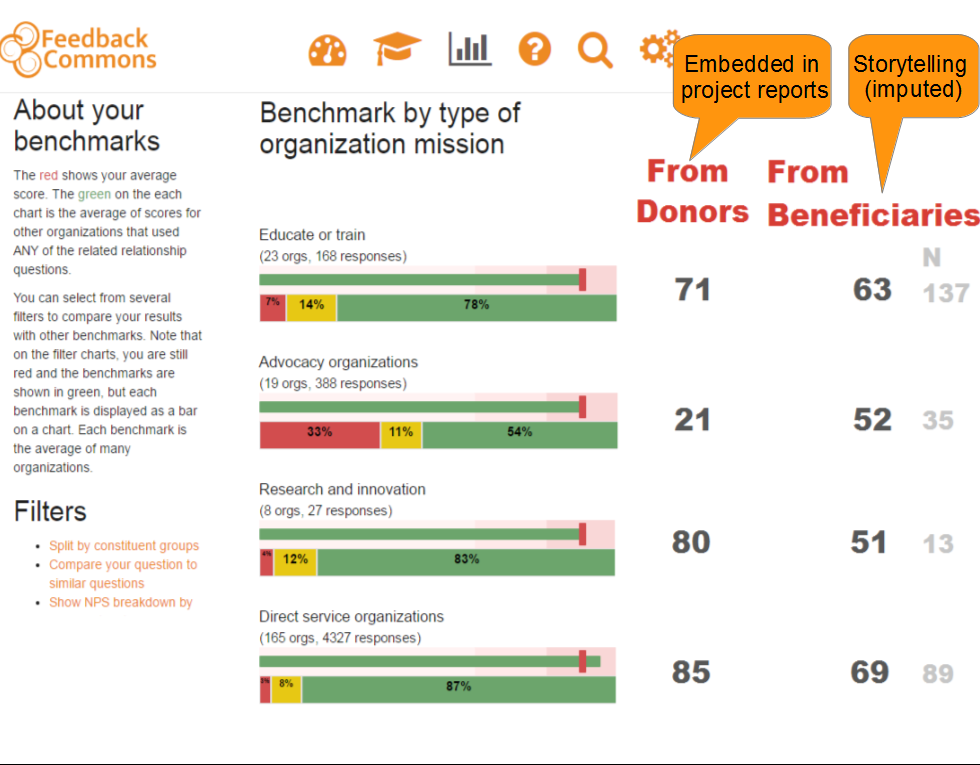
Why feedback loops threaten those in power

I’ve been helping get a collaboration off the ground with the goal of fixing the broken feedback loops in international aid and philanthropy. We call ourselves Feedback Labs. It’s a longstanding problem that people who receive services funded by foreigners have almost no power to shape those services. Those holding the purse strings have sole control. And while leaders in the halls of power where the money originates want these efforts to succeed, there are simply too many self-interested middle men that filter and reshape feedback from those affected, so that only the good news flows. These middle men need the money to keep flowing at all costs.

And even if all the middle men were perfect, there’s the manna from heaven problem. Taxpayers are choosy, but aid beneficiaries would rather get something than nothing. And decades of inconsistently-funded foreign aid programs have trained the world’s poor never to complain, or else even what little benefit was offered them will be taken away. Big aid iterates on whom they serve rather than iterating on how to serve the same population.

So why do we have the gall to believe we at Feedback Labs can fix this problem?

Here’s why.

Exhibit 1: The System (in theory).

basic feedback loop

National and local governments work with institutional funders to provide resources to implementing organizations and public utilities (bus companies, schools, hospitals, electric companies, sewers, etc). These implementers serve the citizens, who are expected to respond by voting to reelect their leaders when services are good and vote them out of office when services fail.

Exhibit 2: the system (in practice).

In practice, the voting-reelection feedback system is too slow and fragile to compel most leaders to improve services. Instead, the system is full of smaller  feedback loops, each of which are complex relationships with their own nuance and incentive structures.

detatiled feedback loop

The dotted lines are broken or failing parts of these feedback loops. NGOs don’t listen to citizens because their livelihood depends on what the funders think of their work, NOT the citizens. And funders can’t just poll all the citizens because only a few of them benefit from any specific intervention that each funder controls. International Funders have traditionally relied on the proposals and reports from their grantee organizations to inform them indirectly about community needs, but these proposals are usually tailored to align with the mission of each respective funding agency. Proposals are not a means to deliver feedback, unless there is a workaround…. which I’ll explain later. But I think America’s healthcare problem best illustrates how the problem could be fixed by delivering timely and actionable information to citizens directly.

Exhibit 3: Broken feedback loop in USA healthcare

broken-feedback-loop-USA-healthcare

Healthcare does not respond to free market forces like other services citizens pay for. You don’t comparison shop when you’re having a heart attack, and even if you did, the USA healthcare system is a masterpiece in obfuscating costs. My friend (a nurse) called up 5 Washington, DC clinics to ask about their sliding scale, and was denied any pricing information at 4 out of 5. I was not allowed to know what my “hit-by-the-bus” insurance would cost when I transferred my residence from Portland Oregon to Washington, DC until after I agreed to a contract to pay this unknown amount. If I were an employee with healthcare, my company would have to subsidize my paycheck an average $700 more per month. As a consultant I get the “freedom” to absorb this cost, or suffer without any real health cure options. And the very fact that health plans are tethered to employment benefits the employer (who can use the threat of losing healthcare to retain reluctant workers) and hospitals (who can charge whatever they want when billing is hidden from citizens) and insurance companies (ditto).

Last week the White House released a brilliant report comparing the same operation at every hospital in America (find the hospital charges dataset here: 3000 hospitals, 100 most common operations). Some operations ranged in cost from $5,300 to $223,000. In one case the same operation cost $3,000 or $97,000 in the same city.

What would happen if I went down to the steps of the hospital and informed citizens of the cost of their procedure before they entered?

This is a true feedback loop. Citizens would have some choice over their health costs – a choice that is carefully denied to them by the system that loves being 18% of total USA gross domestic product (GDP). Curbing healthcare costs is the same as shrinking the economy by 10% (and putting that “lost GDP” back in the pockets on citizens).

Exhibit 4: A dangerously effective feedback loop in healthcare:

working-feedback-loop-USA-healthcare

As soon as I started informing citizens about the hospital’s arbitrary Chargemaster policies (who decides whether a patient is billed $85 dollars or 85 cents for a pair of sterile neoprene gloves — see what scientists pay here), they would surely kick me off their private premises or arrest me. This is where the hospital tips its hand and demonstrates that it is truly a private enterprise in the business of making money first and curing the sick second. Even “non-profit” hospitals make profits; they just don’t have shareholders. And in most medium-sized cities the highest paid CEO is the hospital’s chief (See this ref and Forbes).

This is why feedback loops threaten those in power. It is more than giving voice to the silent; it is about shuffling power. Many acts that increase efficiency also shrink the economy when failing services are replaced with functioning services demanded by empowered citizens.

What citizen wants to give the economy more of his/her own hard-earned wealth?

Exhibit 5: Why the Feedback Labs folks are the best to experiment with fixing the system.

feedback loop members

We work in every part of the system. Our strength is our relationships with these players.

And earlier I said I had an idea on how we can fix the grant proposal system so that it is a better means of delivering community feedback to the “money” people. Here it is:

Exhibit 6: Storytelling data can feed community perspective into NGO grant proposals.

pre-evaluation-report-ngo-feedback-loop

GlobalGiving has relationships with over 1000 NGOs, most of whom depend on institutional funders for the majority of their funding. Although each funder has its unique guidelines and grant structure, many of them allow for supplementary documentation to justify the proposal. Many of these funders would welcome a true community perspective, provided this data was curated by an external party (GlobalGiving) that maintains data integrity. Likewise, this information will soon improve the quality of feedback NGOs provide GlobalGivers (individual soccer moms and globally engaged 20-somethings, etc.).

All NGOs are looking for an edge in the grantwriting process; and community can be that competitive edge. Over time, those NGOs that take advantage of our 58,000 stories and tools will have a higher funding rate, grow faster, and control a larger portion of the civil society’s wealth and influence — all because they are an active part of giving citizens voice. This is a system level change I can live with, even if it will take a while.

And there may be some tricks to accelerate the process. That’s what Feedback Labs is all about – accelerating learning that feeds system change. Giving “voice” will be a good start, but those people will not be satisfied with mere voice for long if things don’t change in the community.

Many of our future experiments are about discovering how to build a healthy appetite for feedback among those who currently hold power, so that it doesn’t threaten them. And some of our experiments are about understanding the reasons why citizens become disillusioned in the process. This latter question is what our new FeedbackLabs interns will be working on this summer, starting with existing data from recent PhD theses, field reports, and feedback experiments others have already done but not yet aggregated. To build a consumer culture around community feedback:

appetite for feedback

We need to start by asking citizens who have already been asked for participatory feedback two simple questions:

  1. Why did you participate with “X”?  (Where “X” is some past effort to give them “voice”)
  2. What did you hope would happen?

The answers may surprise us.

FBL

Empathy in a photo and six words

These are images that tell a compelling story (Curated from Jan-May 2013).
treehouse citiesjpg

A vertical forest is expected to be completed in 2013 in Milan, Italy. There are two tower apartment complexes which contain a total of 400 residential units. The facade of the buildings will be covered with 730 trees, 5,000 shrubs, and 11,000 perennial plants. It is expected to have the same ecological impact as 10,000 square meters of forest (= 0.01 sq km = 1 hectare = 1 official rugby field). This foliage fights smog, produces oxygen, and regulates temperature inside homes.
More info: http://huff.to/YxEDGt — Photo credit: Stefano Boeri

Everyone needs love and companionship

sad lonely whale cannot communicate

The loneliest whale in the world – the Hellen Keller of whales – is on a different wavelength from all her species.

wales welcoming congregation to dolpins

But elsewhere in the universe, whales are a welcoming congregation when they have empathy and can hear the cries.

iraqi orphan girl

This girl is very much like the whale, only she is surrounded by people every day. But do they notice her? This image also illustrates the power of physical space on our psychological being.everybody can be great, because anybody can serve

There is a longer story here about servants and greatness.

A story in a SIX WORD sentence

the six word question

identity

For some reason, this one reminds me of my 16 year old niece. Here are many SIX WORD stories that could go with the picture:

I’m weird just deal with it

Yeah I’m that kind of girl

The odds are not “in my favor”

I’m in my own little world

Can you tell that I’m bluffing?

I don’t want to fit in

I eat soup with a fork

The sky is not the limit

427693_480644771977924_797761254_n

But I struggle to come up with a six word sentence for what this girl is thinking.
hemingwayshoes

For sale: Baby shoes. Never worn.

– Ernest Hemmingway. (Written to prove that stories don’t need to be long to be evocative.)

mechanically separated organic free range chicken

Mechanically separated organic free-range chicken.

Six words to seriously think about.

3d printing standard police Handcuff Keys

Wild things we’ll print at home

(Amazing 3D-printed police handcuff keys)

Yesterday I printed freedom from limits.

I love f&cking science

Insert caption here.

liberty loves blind justiceequal peanuts rights
equal rights vulva

Freedom meets justice in love affair.

We all want someone to run to.

Your satin life cramps my desire.

drunk octopus wants to fight

Re-imagination: Drunk octopus wants to fight!
the illusion of free will

Recognizing the illusion of free choice.

shitlist bucketlist

Shit List contaminating my bucket list.

ladybug-dandelion-perfect-timing

Real or imaginary, we’re going places!

Read more six word stories: http://www.smithmag.net/sixwordbook/

Storytelling Magic

The essence of good evaluation is to capture the 6 journalistic questions (what, who, why, where, when, and how) in a brief, honest format. I believe that defining the “what” is the most important, and one of the hardest to codify. For without these questions answered, the information is incomplete and cannot be used to analyze the  Social Impact or performance of the organization.

This month I am excited that GlobalGiving is launching an upgraded flexible storytelling format with these features:

  1. Universality: one survey framework that can capture the essence of all NGO work because the questions are not output- or sector-specific
  2. Flexibility: implementing organizations decide which questions to use from a larger pool of 20
  3. Benchmarking: because the pool of available questions is limited and shared, every question will have other users that have also used that question, so results can be compared worldwide between implementing organizations
  4. An agile, evolving survey design: Users can propose questions, and we will periodically swap out less popular questions for newer questions after testing.

This combination of features is significant because it puts community-level actors in control of the evaluation process. Organizations choose which questions to include in their story forms and then train local scribes, who go out and collect stories. Responsive organizations will involve these scribes in the survey design directly. These organizations will use our GlobalGiving story analysis tools to understand what communities are saying about the services that aim to serve them. And if they don’t like the questions, they can test and propose better ones, which may get adopted by the larger community of nonprofits interested in a simple and cost-effective way to gauge their performance and guide their strategic thinking.

I hope this will fuel a paradigm shift from Impact Post Evaluation to Baseline Pre-Exploration of ideas that could improve society.

Two Story Rule and Benchmarking

The two-story rule remains the most important part of the storytelling project’s design. Every storyteller must give two stories about two different community efforts they’ve witnessed. Only one can be about the organization that is tied to GlobalGiving. As a result, at least half of the stories we receive do not have the typical self-report positive bias endemic in NGO programmatic evaluation. And when they do, we can tell, because we have a huge baseline of organization-related stories to compare them to. Benchmarking is also the point of a shared system through which evaluation data can flow. These two modes of analysis provide every organization with a “within-group” (two-story-rule) and “between-group” (benchmarking) comparison a fraction of the effort.

Story-based feedback will never be as rigorous as a randomized controlled trial (RCT), but it will be rapid (by 10X) and mostly right most of the time. As this data set grows (1,000,000 stories is possible), it will eventually dwarf RCTs in predictive power.

All that is possible because the design of the survey is finally a dynamic, fluid process controlled by the users of the data. GlobalGiving is merely a data curator, steward of stories and protector of storytellers’ privacy, and builder of analysis tools for everyone to share.

So how is an organization to know which questions work for their evaluations?

Soooo glad you asked. Today I designed a card game version of our flexible storytelling forms that allows people to try out question-combinations and choose the best questions for their version of the storytelling project. All questions will work with all stories, but only some NGOs care about mapping the social conflict in a story, while others care more about crowdsourcing community solutions to social problems, and so on. This way everybody gets what they want answered in the margins because they agree to keep the core (prompting question) the same.

This is rapid prototyping at its best. Organizations can design an evaluation within hours instead of months. I used a free tool for making Magic: The Gathering like card games to design the question set as a game. Now others just need to print the cards  and play the game, in order to gain insights into how our storytelling project opens up many new paths to understanding community context around the community efforts organizations lead within them.

Storytelling Design Game

Premise: Each player will select a story from GlobalGiving’s set at random, and read it without any of the other players seeing it. Best to save the story ID# in the URL for end-game reference:

Hope Does Not Die - Story #19919 - GlobalGiving.org

Goal: To win, be able to summarize another player’s secret story solely from the questions you have asked him from a minimal set of cards. Higher scores result from inductively understanding the story with fewer than 10 questions. “Closeness” of your final answer to another player’s actual story text is best determined by an outside judge, or by group consensus and ridicule (like Apples-to-Apples judging)

Rules and turn by turn play: After each player has secretly selected and memorized a random story, they take turns playing one card and asking the other player to answer the question about the player’s secret story. If there are three or more players, target the clockwise player with questions in a round-robin style of play.

Note: Some of these question cards are more relevant to other interpretations beyond the “what” in the story. I’ll come up with rules for how to test these aspects of the survey later. But in general the game rules are designed to be as closely aligned with the actual survey goals as possible, so that this is a good simulation.

So a good survey needs to answer these questions in this order of decreasing priority:

What, who, why, where, when, and how

Interpret “how” as being about the process that the organization approached the problem and carried out its intervention. Who is both the organization and the type of person the storyteller is. “What” is the essentially the whole story, or at least the 3 to 5 most important elements in it. What was the sequence of events? Who was the story about? What happened to the main character in the story? What role did the storyteller play?

Some of these questions are straight-forward and map exactly to a card:

main_character_cardorg_name_cardstoryteller_role_card

Whereas many other aspects of the story are fuzzier, and the questions are also fuzzier to match:

Solution questions

solution_cards

End Game: Players continue using cards to question each other for up to 10 rounds. After 10 cards have been asked of all players, go around and have each player summarize the other player’s story.

If a player wishes to summarize in less than 10 rounds, award them a 5 point bonus. Typically, each play gains 10 points for summarizing the story correctly at the end of 10 rounds, though the judges can decide to award less than full points. If a player that guesses early but does not get the full 10 points awarded, he gets no bonus points. A player that doesn’t get at least 7 out of 10 points instead gets ZERO points. Keep playing for multiple rounds, or until one player reaches 50.

The complete set of question cards for testing/playing

scope_set_cards

conflict_cards feelings_benefit_cards identity_cards

Some questions are in testing phase, such as the one where you can design your own question during the story listening process…open_ended_cards demographics_cards

Here is the PDF if you want to download and print the set:

storytelling design card deck

storytelling design card deck (30 cards) version: May 1, 2013

Storytelling deck builder (30cardset)

If you think this is cool and want to be part of the team that builds tools to analyze these stories, we’re accepting applications for a Big Data Scientist in Training in the month of May, 2013. You would work with GlobalGiving and >FeedbackLabs.org.

This project is about putting a face on the people affected by GlobalGiving and its partners’ work. So I’ve decided it was time to put a face on them. Literally:

gg_storytelling_logo

Any suggestions on what kind of faces to put on the green and yellow people? Comment below.

The pythonic way to do international development

Here I describe how the stages of learning to program in python mirror the levels of design complexity that international development agencies deploy to tackle problems like sending children to school or ending global poverty.

First – some context about what python is and why it matters.

In the future we will all be program managers

I’ve been teaching myself how to program in python for the last 2 years now. Why? Because I needed to accomplish tasks that demanded more than just excel and whatever else is out there for the “everyman” to use. Now I cannot imagine working without it. I believe that in a generation, “literacy” will be defined by one’s daily use of a programming language like python.

Do you remember the era of calculators, when logarithms and exponential functions were the sole purview of engineers, statisticians, and other “data experts”? Today we treat statisticians as specialists, but that is changing because the world is inundated with data, and linear inferential statistics is just one way to approach the problem. The other ways all require some programming prowess.

And before that, “human computer” was as a career. From the seventeenth century until the era of digital computers, groups of mostly women were paid to manipulate large sets of numbers in a methodical fashion. Some mathematicians were known to even “marry their computers.”

So extrapolating from history, everyone will be a programmer by the time I have gray hair.

pythonSo what is python anyway?

Python is more than a programming language; it is the language of interoperability.

python-import-bacon

Basic scripting doesn’t need to be elegant, it just needs to work. And python provides a “low floor, high ceiling” space for people to program solutions to everything. “Low floor” means that anyone can get started with just a few lines of code, and most of these lines read like plain English. “High ceiling” means that as people use python they discover ever more elegant ways to do the same thing, often with huge performance gains. Even the process of writing error-free code can be done in much less time, because python tolerates errors and ambiguity better than most languages.

Strive for pythonic over perfection

For something to be “Pythonic” means it embodies the simplicity, readability, and elegance of the python way of doing things. What this design principle sacrifices in absolute performance (computing speed) it more than makes up for in time saved writing, debugging, and improving the code later. A long time ago a smart fella named Guido realized that most problems aren’t solved in one step, but require iterative cycles of testing, learning, and redesign. Therefore each cycle is faster if the code is pythonic. Some programmers even speak of the “Zen of Python:

zen-of-python-poster-a3

The only Zen aphorism I quibble with is “in the face of ambiguity, avoid the temptation to guess.” I believe the next generation of pythonic programming will apply a lot of heuristic guessing to unlock the tools to the masses.

Making code understandable to everyone is a subversive attack on the monopoly of the programming world. For if something is intuitive, we can teach ourselves. We can invade the lucrative kingdom of the programmer. Our children will grow up programming their phones the way we program our music stations to feed us what we want today. We will still need paid professionals, of course, but they will be called upon to manage the most complex tasks.

If python was a religion, it would be Unitarian Universalism, as explained here:

Python is simple and unrestrictive; all you need to follow it is common sense. Many of the followers claim to feel relieved from all the burden imposed by other languages, and that they have rediscovered the joy of programming. But there are some who dismiss it as a form of pseudo-code.

In contrast, the Religion of C has been described this way:

C would be Judaism – it’s old and restrictive, but most of the world is familiar with its laws and respects them. The catch is, you can’t convert into it – you’re either into it from the start, or you will think that it’s insanity. Also, when things go wrong, many people are willing to blame the problems of the world on it.

And java (and javascript):

Java would be Fundamentalist Christianity – it’s theoretically based on C, but it voids so many of the old laws that it doesn’t feel like the original at all. Instead, it adds its own set of rigid rules, which its followers believe to be far superior to the original. Not only are they certain that it’s the best language in the world, but they’re willing to burn those who disagree at the stake.

Python feels empowering to the novice, yet welcoming to the journeyman, because it has a sense of humor about itself. It is, after all, named after Monty Python.

xkcd-python

The philsophy behind C is very different. Its name comes from the idea that computer “machine code” is an A-level ASSEMBLY language. Assembly language assigns values to registers on the CPU microchip itself.

Machine code looks like this. Clearly, not meant for human consumption EVER:

8B542408 83FA0077 06B80000 0000C383
FA027706 B8010000 00C353BB 01000000
B9010000 008D0419 83FA0376 078BD98B
C84AEBF1 5BC3

This function in 32-bit x86 machine code calculates a Fibonacci number.

Assembly code looks like this:

SET r1, 10
SET r2, 1
LOOP1TOP:

SUB r1, r1, r2
CMP r1, r0
JMP NEQ, LOOP1TOP
SET r2, 20
LOOP2TOP:
LOAD r1, X
CMP r1, r2
JMP EQ, LOOP2END
...
LOOP2END:

In the 1960s, 1970s, and 1980s people developed various B-level languages that would be more readable but directly translate to operations performed on bits in microchips. Most of these were still unintelligible to the masses. C is the third generation, or C-level, attempt to bridge machine code with English in an efficient way.

C++ code looks like this:

for (i=10; i > 0; i--) {
... // loop1 body
}
while (x != 20) {
... // loop2 body
}

Python code looks like this:

data = list()
for x in range(20):
data.append(x)

But if you are familiar with python, it is just as “correct” to write the same code in short hand:

data = [x for x in range(20)]

That’s how I would write the program. In one line of code, called a list comprehension. It is easy to understand, concise, and translates to machine code almost as well as C, because Python’s interpreter is actually written in C.

And while the top five programming languages in the job market are all derived from C (java, C, Objective-C, C++,  and C#), there is another story here. Many people using python didn’t learn it to get a job, but rather to eliminate work from their job. The language of interoperability ought to transcend and absorb the best of all the other specialized programming languages, which python does. Its modules incorporate features of C, Java, Perl, Haskell, Lisp, and other langauges. Cython and Jython are essentially versions of python designed to make writing C and Java easier.

jythoncython

While web browsers don’t read python (they do read php and javascript), you can write websites in python.

bitnami-djangostack cherrypy

And over half a million $25 circuit boards based on python have been sold:

raspberry_pi_inside

And scientists? Yeah, we use python in our data analysis.scipy_conf_logo

Test first, second, third… scale later

Python is a prototyper’s dream. Its ease and readability come from being a ‘dynamically typed’ language, unlike C. Python doesn’t require variable declarations and a variety of other structural rules found in other languages to run. You can get started in python with a tiny bit of knowledge. As your projects get bigger and more complex, you can later impose structure on your code to avoid errors. And when you’re serious about performance, you can simply use the more advanced Python modules which “wrap around” high-performance C functions.

I believe the logical evolution of this strategy is to a visual graphical programming interface where people can connect chunks of code together like cogs and widgets in a machine, but underneath they are organizing functions in real code they never see. In theory, a 5 year old could write a smart phone app this way. In fact, kids are already using RasberryPi boards to do this.

So what does pythonic international development look like?

The point of this lengthy introduction is to introduce a set of design and program evolution principles that make sense in international development.

  1. Amorphic scripting: At the beginning – you’ll write your first program as a linear script with a “just give me the answer!” mentality. You won’t care about structure, legacy, or efficiency,  just what works.Surprisingly, quite a number of non-profits start out with an amorphic scripting mentality to their work. A person sees a crisis and take charge to alleviate suffering. And they can see that they are making progress, up to a point.At some point, usually 2 years into running a new organization (or 6 months for a new programmer) this approach starts to break down. Work is taking more work to make fewer gains. Staff feel like they are tackling the same problem repeatedly.This leads to the next level in program design: Modules
  2. Functional programming: After a few tries at programming with a sequence of instructions, most people realize the power of organizing their bits of code into functions. Modules are collections of functions with a related purpose. Python uses a ‘namespace’ to keep all these sets of functions organized. So if you were to “import antigravity” as the comic shows, it would keep these functions separate from some other “fly” function you might be using in the same program. By the way – DO try to import antigravity in python; it works.Nonprofits come to a similar realization and tend to hire full time staff members with specific tasks, such as grant writing, marketing, program managing, advocacy, and youth engagement. They tend to hire the monitoring and evaluation officers last. These appear to offer less bang for the buck until you realize that you are trying to do solve a complex problem. Without monitoring and evaluation tools and methods, you begin to lose track of what worked and what didn’t. Your versions of social programs get muddied in your memory.The same happens in programming. The next stage is using a code repository like GitHub for version control and collaboration.
  3. Collaboration and knowledge management: Repositories (or repos for short) allow programmers share code, or fork the same project into multiple subprojects while tracking changes to the original idea. GitHub has ~4.6 million repositories and 2.4 million users; that’s more than 1 repo for every community group in the world.The nonprofit world has tried to create “communities of practice” and “best practices” and write training manuals, do capacity building, and establish guidelines – but none of these come close to the simplicity of version tracking and knowledge dissemination that GitHub has provided the open-source computer programming community.And in fact, the nonprofit world’s whole approach to this problem appears to be on the wrong track, according to a recent PlosOne paper: Searching the Clinical Fitness Landscape. I’ll be re-blogging this paper in plain English soon, but what they show is that randomized controlled trials (RCTs) and centralized knowledge dissemination do not improve patient outcomes as well as fostering many decentralized smaller quasi-experiments to improve practices.  (or… Many people trying to achieve slightly better practices beats everybody trying to adopt a few best practices).Forking a GitHub repo and publishing a tweaked copy of an idea yields better and better code in the long run. And in fact, python was created that way. Most of python’s power is in the modularity of all the functions. You can run it quick and efficient and sparse or you can import some Goliath modules like scipy or nltk (natural language tool kit) that give you the full power to analyze data, albeit with higher memory usage.

    But even the ability to share code pales in comparison to the power of real-time error checking, which is the next conceptual leap that programmers make.

  4. Iterative design and testing - eventually a programmer will have created something useful enough that it is time to publish a product. Some tool, software, website, or analysis will require a bit more maintenance. Strangers are using your tools and messing up your code, finding all sorts of bugs as they do things you never anticipated. Your new feature development grinds to a half as you spend all your time maintaining the code wasteland you once so lovingly believed was crisp and elegant.This is where I am. Luckily my friend turned me on to py.test and TRAVIS.CI.These tools allow you to write a series of debugging scripts that will automatically try to break your code each time you push updates to your GitHub repository. TRAVIS.CI emails me whenever it finds a bug in my code. Py.test allows one to write the “business requirements” of a program before even writing the program itself. It is a different way to manage the problem, but ultimately a better one.Nothing in international development seems to mirror this feature. If it did, it might be some combination of real-time feedback and peer group benchmarking on progress towards stated goals.
  5. Agile, iterative thinking - and along the way many programmers realize that solving problems is going to be an iterative process, so they adopt agile.In international development, I’d summarize this as going from an idea to a working prototype in 14 days. Any idea too big to test in 2 weeks is too big to succeed, period. Either your resources are too scarce to handle the task, or the task is too big and complex to be feasibly managed. Most big ideas can be broken down into 14-day prototype tests. Agile says this is the best approach.

    Test your idea in a small chunk, then refine it and reexamine your assumptions. Let that TRAVIS.CI real-time bug checker crunch on your prototype while you do these tests, and you’ll find yourself becoming very good at “programming” whether you mean coding or running social programs. Both require some flexibility to adapt.

  6. Upgrading the language to unlock new capacities: A slim few programmers realize that they have been constrained by the language they were using to write code, so they begin working on a better way to write code. Python was one of those examples, but it will not be the last one.Python was a step forward because it allows people to be competent problem solvers regardless of their level of expertise. It emphasizes readability and elegance so that people minimize the time they spend debugging or describing the problem. International development is sorely lacking in people who have the audacity to rewrite the coding language it speaks. It doesn’t speak the same language from one group to the next, and much of it looks like machine code to me:

    8B542408 83FA0077 06B80000 0000C383
    FA027706 B8010000 00C353BB 01000000
    B9010000 008D0419 83FA0376 078BD98B
    C84AEBF1 5BC3

References

http://blog.startifact.com/posts/older/what-is-pythonic.html

http://python-history.blogspot.com/2009/01/brief-timeline-of-python.html

http://blog.aegisub.org/2008/12/if-programming-languages-were-religions.html

http://wiki.answers.com/Q/Why_name_c_language_is_named_as_c

http://en.wikipedia.org/wiki/Type_system

http://www.cprogramming.com/langs.html — comparison of programming language styles

http://www.tiobe.com/index.php/content/paperinfo/tpci/index.html — index of job growth by programming language

http://img4.joyreactor.com/pics/post/9gag-auto-264324.jpeg — comparing programming languages if they were used to write an essay

I choose programming plagiarism over incomprehensibility.

programming languages

The path to resurrection is paved with failure

Although Jesus was divine but fallible, His followers created an institution that elected a pope whom they claimed to be not divine but infallible.

This, in a microcosm, is the story of Humanity. We want things to be perfect and we put our heads together to make it so, but we simply refuse to accept the truth about all meaningful endeavors: (1) they are hard, (2) we will fail (a lot), (3) we’ll lose some of our support if we are committed to change.

It is good sign that Pope Francis will start this Passover by washing the feet of a dozen prison inmates. Gone are the red designer shoes. Prostrating oneself before sinners as a servant to all is the only way to find wisdom as a leader. I wonder how many of other “infallible” leaders of government and philanthropies will copy him.

Jesus experienced a lot of failure in his three year ministry.

He started by preaching in Nazareth where he proclaimed that the prophesy of Isaiah had been fulfilled by his coming. He was quickly thrown out of town, and nearly stoned as a lunatic.

He gave countless sermons that were not recorded because they lacked pithy aphorisms or unclear messages. Many of his parables were forgettable. But he improved because he continued working at it and refused to peddle the same tired ideas of other Rabbis. He could have grown a flock this way but he would never have matured into one who speaks truth to the rich and powerful.

How do we know? We find the fewest accounts of failure in the Gospel of John (written last, and by his most zealous worshippers). We find more in the Gospel of Mark (written first, and with the least editorializing). And we find the greatest number of half-finished sermons and difficult-to-understand aphorisms in the Sayings Gospel of Thomas. This version of Jesus attempted to write down everything Jesus said without wrapping it in a narrative that contextualizes what each saying meant. It reads like an internal draft of an Impact evaluation conducted by a large aid organization. The version that is released to the public is the Gospel of John. But if you want to understand the process underneath the tidy conclusions – you need to see the internal draft copy.

Jesus’ failure continued. In spite of his preaching, the idea that he was a political Messiah grew. Crowds followed him, waiting for the revolution, when the revolution he was talking about was the act of loving first, listening to God, and acting with whatever resources one had to help those who need it. He was a failure at getting his message across, because it was radically different and not at all what people wanted their Messiah to do.

Even his twelve most trusted disciples didn’t understand the kind of innovation he was talking about. Time after time he would additional closed-door sessions with his board to explain his parables and bluntly inform them that the Kingdom of God was a state of mind, a transformation of the soul, and something so close at hand that the only barrier to salvation was a lack of understanding. Jesus had a theory of change, and it didn’t fit into the boxes they were expecting on the flow chart. They were confused because they had unshakable faith in the system (theories of change, political leadership, economic warfare) and no faith in His alternative (change starts with your soul, economic salvation follows when the spirit is grounded in God and every thought is focused on God’s Will).

And this befuddlement continued even after His death. It wasn’t until six weeks after Jesus’ death that the significance of his message finally hit his followers (the Pentacost). If this isn’t a story of one who failed for most of his life as a communicator, I don’t know what is.

To be fair, Jesus had successes as well. But don’t you think someone who could cast out demons, cure the blind, and make the crippled rise up and walk on command should have been able to get his message across sooner? Most preachers use this to illustrate how fallible we are (until we get elected as a leader or pope and then suddenly become infallible, of course). I use this as an example that systems of people will resist innovation and fight the changes necessary for prosperity to flow. It doesnit matter whether your ideas are right or wrong – it matters that prosperity requires both the leader and the crowd to work together and achieve a common understanding. This is something we as a race are seldom prepared to do. We should be studying the rare occasions when it does happen to understand how to alleviate poverty.

So not only was Jesus’ ministry filled with failures, His followers continued to do the flock a disservice by editing out all the Human failures from story of a divine Jesus. Too often I struggle to illustrate the path of innovation in my nonprofit work. Last week I literally demonstrated how many starts and stops our idea took over three years on a poster, and explained how much further it has left to go. I wanted people to focus on the nature of the problem – that people want institutions to create innovation but institutions fear the people finding out how messy it looks. And so the institutions do themselves a disservice by not talking about the process, and so the people come to believe ever more strongly that success stories ought not to contain any failures along the way. It is a virtueless cycle.

Last month I was speaking to a group of counter-terrorism experts from around the world. For an hour I spoke about about failure. My talk was titled “From idea to prototype in 14 days.” My message was that we can succeed in solving complex social problems, but the process requires us to test an idea quickly and iterate on the solution dozens of times before scaling it. It is crucial that everybody understand the word iterate. Iterate means “we failed, but we have a better idea of what to try next.” Iterative learning turned pools of cell sludge into human beings through Evolution. Iterative learning turned gears and pulleys into vacuum tubes and then microchips and converted an abacus into an iPad. It is the reason why society is so complex, and why quality of life improved.

But at this counter-terrorism meeting, a room full of policy makers and key advisers to world leaders, there was no room for failure. They spoke bluntly. Attitudes ranged from “In our position we cannot accept failure of any kind” to “failure simply does not exist in our field.”

I argued. “What? Don’t you get it? The only reason that you have something to write policies about is because Science created technology that improved life on this planet. The twentieth century is a story of innovation through this failure-driven process I just described. I don’t think there is any evidence that policy or ethics has changed much in the last century.”

I meant the process by which groups of people create and agree upon policy, and not the policies themselves. But my words only shocked and angered people. My views were parochial – from a scientist who doesn’t “Get it”. And I don’t “get it” because I surround myself with entrepreneurs, scientists and others who achieve by trying new things, people with some tolerance for risk.

Looking around the room, I didn’t see anyone who’d ever worked as an entrepreneur. I doubt any policymakers can ever succeed until they first experience the messy process by which nice things are developed.

I was a pretty poor communicator to this group. My message was not what they wanted to hear. The record of that meeting will most likely omit any messiness of debate about failure because the meeting was about policymaking, and not process. And this experience helped me understand what Jesus must have felt like for three years of ministry – preaching about the Kingdom of God that had nothing to do with policy, politics, or forced wealth redistribution. Jesus said (in the Gospel of Thomas only):

“If those who attract you say, ‘See, the Kingdom is
in the sky,’ then the birds of the sky will get there first. If they
say to you, ‘It is under the earth,’ then the fish of the sea will
get there first. Rather, the Kingdom of God is inside of you, and it is outside of you. Those who become acquainted with themselves will find it; and when you become acquainted with yourselves, you will understand that it is you who are the sons of the living Father. But if you will not know yourselves, you dwell in poverty and it is you who are that poverty.”

He continued. “If you bring forth what is within you, what you
bring forth will save you. If you do not bring forth what is
within you, what you do not bring forth will destroy you.”

This is a story about having the courage to try, the wisdom to embrace failure, and the tenacity to continue iterating – because fear of this process will destroy us. We don’t need to be divine or infallible. We just need to start by washing the feet of a dozen prison inmates.

The future of big data is quasi-unstructured

I’ve previously talked about using trello as a free project management tool. Today I found a natural tool to complement it in RescueTime, which tracks what you are doing on your computer without requiring any intelligent input from you, the user:

RescueTime - Dashboard

hour-by-hour breakdown friday

RescueTime figures out what you are doing on your computer as soon as you turn it on and produces useful graphs to track individual worker productivity.

Integrating this with trello:

Heuristic Social Auditing - Trello

Yields a very powerful way to track projects and all work done on computers without the burden of structuring the input or even asking the user to do any input at all!

I routinely hire freelancers to work on projects. And when I have a full-time freelancer doing a project, I expect to see 8 hours a day devoted to tasks that logically line up with that project, such as software-development (the largest bar on my RescueTime chart). This tool enables me to evaluate and manage people even when the tasks are hard and complex – and don’t yield immediate results.

The information strategy here is a core part of future “big data” revolution. Here’s why:

In the future, the most useful data will be the kind that was is too unstructured to be used in the past. Algorithms to “wrap” many different kinds of structured data together (i.e. APIs for popular sites like twitter) or apply a structure to disorganized content (i.e. python’s BeautifulSoup module) are going to make most data easier to exchange. For example, I just built a heuristic auditing tool which accepts any kind of data and yields a report. (Test it at djotjog.com/audit)

In more abstract language, I am saying:

The future of Big Data is neither structured nor unstructured. Big Data will be structured by intuitive methods (i.e. “genetic algorithms”), or using inherent patterns that emerge from the data itself and not from rules imposed on data sets by humans.

Big Data means:

Information sets that approach the size of all information known about “X”. For example, instead of a sample of e-books, it means a comprehensive set of all e-books ever written (~70% to N=ALL). Big Data sets are noisier yet do not require us to know beforehand what questions we will pose of it. We can drill down in Big Data sets and ask arbitrary questions. It is a complementary method to statistics, which rely on sampling to eliminate bias through random sampling. Instead, Big Data assumes bias and quantifies what the biases are in the data set, so that they can be detected, inspected, and corrected.

Genetic Algorithms:

Seek to “evolve” a computational solution to a problem in a manner similar to how biological systems evolve over generations. It requires the problem to be characterized and encoded as a set of rules in a game-like program. The program also requires that any possible solution is able to be scored against other solutions, so that the best solutions from each population of solutions can be selected, mutated, and “mated” with each other to generate new solutions for testing in subsequent generations. See examples with goats, robots, and the Mona Lisa.

Intuitive Algorithms:

Intuitive algorithms play a guessing game with possible ways to structure a data set, and iterate on the result until the structure is good enough.

Emergence:

Emergence is the way complex systems and patterns arise out of a multiplicity of relatively simple interactions. The sum is different (or at least difficult to predict) from its component parts. Meaningful data structures based on emergence are hard to develop with exiting programming, but intuitive algorithms and genetic/evolutionary approaches to algorithms will likely make emergence structuring much more feasible in the near future.

The the degree of “structure” in data sets lie along a scale, yielding different results when these approaches are applied to them:

Types of quasi-structured data and examples of each

  • totally unstructured data — google search results cover all websites, but are hard to further categorize without access the google database itself
  • intuitive-structure — my wordtree algorithm accepts any pasted text and yields a network map based on similarity of langauge within the text, as well as proximity of words to each other within the text. But it is not “tagged” the way youtube and flickr track content in images
  • emergent structure — algorithms to extract the main idea of groups of stories
  • pseudo-structuring – looking at content and assigning structure to all possible variations of a single document type, such as I did with the auditing tool.
  • guess, apply a rule, and refine — in this mode the algorithm tries an approach and refines it iteratively based on user feedback. IF the feedback is automated in the form of a score on the result, this approach becomes evolutionary programming.

(I am still figuring out how to describe this – so some of these above examples may be the same thing.)

These strategies for structuring Big Data have come about as a consequence of two trends. First – 100 times more content is added online each year than the sum of all books ever written in history. Second – most of this content is structured by institutions that for various reasons don’t want to release the fully annotated version of the information. So pragmatic programmers like me build “wrappers” to restructure the parts that are available. Eventually there will be a universal wrapper for all content about financial records, and another one for all organization reports. These data sets will organize content into clusters that are similar enough for us to study patterns on a global scale. That’s when “big data” begins to get interesting. Today, we’re in the early stages of deconstructing the structure so that we can reconstruct larger data sets from the individual parts that each have unique yet “incompatible” structures. It is like taking apart all the cars in a junk yard so we can categorize all the parts and deliver them to customers that want to build fresh cars. You see cars go in and cars go out, but a lot happens in between.

Last year, if someone had asked you to track all the work you do on your computer, you would have probably filled out a survey (like the “time tracking” reports I fill out monthly at work). In the future your computer will fill them out for you and in greater detail, and these data will be “mashable” with other reporting systems. This will not happen because two systems are built to work together, but instead because someone build a third system that allows two systems to share information. Eventually we will build “genetic algorithms” that will write programs that can re-organize data into usable structures regardless of how the original data was structured. This is going to happen in the next ten years and we will ask ourselves why we didn’t do it sooner.

Turning victims of fraud into agents of change

Four weeks ago I attended a stunning talk from Jean Ensminger hosted by the Center for Global Development. She presented her findings about a vast network of corruption within the Arid Lands project of northern Kenya. One of her approaches was to compare sets of numbers in documents to a Benford’s distribution. It works because the leading digits in any batch of numbers that count real objects or expenses will always form a logarithmic pattern, but when people try to make up random-looking numbers, they turn out to be very non-random.

Her talk stunned and inspired me – stunned because of the scope of what her team uncovered, and inspired because I realized that one of the methods was so simple even a computer could do it. So the next day I built that tool and blogged about it.

djotjog.com/audit

Djotjog heuristic financial auditing - march 18-2013

I called it a heuristic auditor. It looks for patterns in documents the way anti-virus programs detect new malicious code. And like Sesame Street, it operates on the “which of these things is not like the other” principle. If one uploads a document and it resembles a batch of known, legitimate documents, it passes. It’s as easy as that.

This is not a forensic auditing tool. Forensics is about determining the exact cause of death for one specimen. In contrast, a heuristic autopsy would tell you the probable cause of death, but not always the right one. But heuristics is a form of high-throughput analysis. All deaths are declared by someone using a heuristic because doing an autopsy on every patient would waste time and money. Coroners only perform autopsies when the signals are unclear. This distinction matters both to how one should interpret the results and also in explaining the time and cost-saving potential of inspecting all documents heuristically (for free) versus inspecting a tiny fraction of them forensically (as it is currently done).

The response to this tool was very positive. Sam Lee from the World Bank invited me to lead a team at their next DataKind Hackathon event where we made it both simpler and more sophisticated – simple enough that anyone could upload a document and understand whether it passed or failed, even if he/she barely understood English. It also grew more sophisticated because it analyzes all the words and phrases in the document in addition to the numbers. Soon it will also look at dates and show the user where they cluster along a time line. The results use images, placing your document on a “reference” bell curve, and changing the dot to red or green depending on whether it was a good or a bad sign.

bell-curve-fail

I believe that the victims of fraud have the strongest incentive to report it. And yet, most victims in the developing world are poor, under-educated, and disconnected from power. While it would be nice for those with technical skills to be looking out for them, I believe it is far more practical to transform fraud detection tools into something any person can use to look out for himself or herself. Some of the poor still have access to documents, but until now they had to convince a politician, journalist, or organization worker to take their allegation seriously. That job just got a whole lot easier with this simple tool.

This could transform the victims of fraud into agents of change. Here are some use cases:

reporter_penA journalist in Zimbabwe gets handed a CD with 500 finanical documents that allegedly show fraud. His article deadline is 36 hours away. Where does he start? Instead of sifting through them for hours, he can scan a sample of them and get a picture of how sketchy they are in minutes. He therefore knows whether this lead is credible, and therefore how best to spend his remaining time. He also has data from which he can begin a conversation with some “expert” economist who typically provides color commentary in articles – but this time the question is pointed, specific, about how that person interprets the data in this specific case.


grandmother_school_kids

A grandmother in Kenya pays school fees for two granddaughters, matched 50:50 by a local organization. One month she has realized the organization stopped paying. After getting the run around from the organization, she suspects misconduct and gets her nephew to access the internet and find the organization’s documents on their website. Pulling the budgets, she realizes that they fail the test. She can now launch allegations with journalists or funders that have credibility.


clip-art-police-officer-iconA policeman in Afghanistan believes his boss is siphening off his paycheck and those of many other patrolmen. He “borrows” a sample of financial records the boss has signed off on and runs them to realize that according to Benford’s law, specific digits in numbers are being doctored.

Read the full story: Thanks for the Raise!


evaluator_travelerA NGO program manager has been receiving fishy reports from another country post for months. She knows they’re remote and haven’t been visited in a year. To justify a surprise inspection, she runs all of this post’s reports through the tool to justify the expense and need for secrecy to her boss.


surveys in hell

A census team suspects that a few of their surveyors are not going door to door, but merely sitting in a Starbucks sipping lates and making up numbers. They run all their reports through this check and archive results as soon as each form is uploaded using the tool’s API. As a result, a few of their surveyors stand out as producing consistently bad data, and are terminated.


africa pipes reportingAn NGO is about to submit their report, but they run all their receipts and budget proposals through the system just to be sure it passes, because they know the funder will also be doing the same thing. This form of “defensive self-auditing” could become a standard behavior when both sides of a financial relationship know the other one is going to auto-check numbers heuristically.


surveyorA funding organization background checks thousands of potential partner grantee organizations’ budgets each year by hand. But using this tool, they can immediately predict the likeliness that each uploaded batch of financial documents will pass muster as soon as it hits the server – before a human even reads them. Where documents are incomplete or simply lacking in the kinds of detail found in hundreds of other approved budgets, the system rejects the document and sends instant feedback email to the partner requesting them to provide a more detailed budget. This not only reduces turnaround time, it also reduces staff time spent on each application, and increases the rate that organizations  learn.


globalgiving ideas bumper stickerThis last example is why GlobalGiving – where I work – is going to benefit from this idea. While it is just a small part of the larger and more sophisticated “heuristic due diligence” process I helped develop there, it is exactly the sort innovation that in the aggregate helped this non-profit achieve a 100% cost-recovery-from-services model in just 10 years.


The business case

(Thanks to Dominick and Dennis from my DataKind team for this part):

  1. Turns the victims of fraud into agents of change
  2. Contains fraud at the source
  3. Cheap, easy, scalable, automatable process
  4. Easier to analyze unfiltered data (not the aggregated reports that get sent to the central office).
  5. Incredibly simple to use

Next steps:

  1. Write a simple tutorial, with examples of where it is appropriate to use this tool. (Some guidelines found here)
  2. Gather other large “reference” data sets for other financial document types, including receipts, invoices, and contract bids.
  3. Engage the end user and gather feedback on how to improve the tool and the mechanisms for reporting corruption.

However, this tool doesn’t solve the incentive problem.

With any innovation there are four criteria that determine whether the masses adopt or ignore a new tool, idea, process, or technology. If a person answers YES to these four questions:

  1. “I care about this.” – relevance
  2. “It is easy to use.” – simplicity
  3. “I believe it will change things.” – agency
  4. “I feel like I’m being heard now.” – democracy

It gets adopted. Even three out of four is good. Victims of fraud care about fraud, may find this tool easy to use, and believe that their action will change things. Even if things don’t change quickly – they will feel like they are being heard if there are obvious mechanisms for where to send the feedback (i.e. IPaidABribe.com)

I can’t improve environment in which victims of fraud find themselves, but I hope this gives them “agency.” We must ask ourselves, who listens to the victims of fraud? And who acts on allegations?

If the answers are unclear to us, you can be sure they are unclear to the victims as well.

This story: A completed feedback loop in 30 days

feedbackI am quite satisfied that within a month of the talk at CGD, there is something tangible that has changed. The CGD talk raised questions about whether our current system has the ability to keep itself honest and catch fraud. It inspired actions that produced a tool that would have given the very victims of fraud in that system – village leaders alarmed at the unfair distribution of goats and cash within the village – the power to detect, inspect, and correct it (by raising the alarm with journalists and government leaders who would not ignore allegations backed by evidence). This does not solve the incentive problem (i.e. these leaders could gain more by ignoring the problem than they could by reporting it), but it does give the power to good people who are driven by a morality that yields greater riches than wealth itself.

Try it out! http://djotjog.com/audit - heuristic auditing tool

Related post: The Weekend I audited the World

Related video from the DataKind Hackathon:

True picture of Innovation and iterative learning within GlobalGiving

qr-citizen-voices-2013-poster

Too often innovators present their novel approaches as a linear process of defining a problem and finding a solution. This poster presents innovation the way it actually happens – as a series of false assumptions, missed-targets, lessons, and cycles along a timeline. I’ll present this at the World Bank / InterAction / Civicus conference about Citizen Voices on Monday (3-18-2013).

Storytelling innovation timeline 2009-2013

The fine print within the squiggly timeline are all the partner organizations that GlobalGiving reached out to over the years. Green orgs were fruitful relationships and red orgs are those with whom we talked on multiple occasions without resolving to do anything. Brown org names are those in between. In preparing this poster I realized that those who helped us improve upon the idea the most were local orgs. You can follow the live event on Twitter with #wblive and the ongoing conversation with #engagevoices and @feedbacklabs.

More context on the storytelling project:


What is GlobalGiving Storytelling tools 2013 Storytelling Data Uses 2013


An aid to AID: SMS image xfer service

It is easy to pontificate on how images from people in developing countries could be sent by phone and aggregated into meaningful information to fix aid projects or democracy. What’s harder is actually implementing such concepts.

Today’s “aid for AID” is one attempt to solve this problem using SMS and twitter. The limitation is that only 140 characters can be used to encode the whole image. Conventional schemes for storing images would take thousands of characters. Here is what some people have tried as part of a StackOverFlow bounty (contest for 500 points of reputation):

http://stackoverflow.com/questions/891643/twitter-image-encoding-challenge

4

Note that all of these solutions employ a UNICODE character set (thousands of unique symbols, including all chinese characters) instead of an ASCII set (256 letters numbers and symbols).1 2

This next solution was written in python.3

This next example is what you get with conventional image compression methods (536 byte Mona Lisa). This poor quality image would still require 4 tweets to send, whereas the python abstract art approach requires only one and gets at the “essence” of Mona:

5 traditional image compression

And here is the original solution that people tried to beat. It uses vectors to geometically map her face :

7

My favorite approach: The Genetic Algorithm

This genetic algorithm that Roger Alsing wrote has a good compression ratio, at the expense of long compression times. (takes hours instead of seconds)  The resulting vector of vertices could be further compressed using a lossy or lossless algorithm, but what you see is an actual “code” for the information in the image itself, and not just a trick to approximate pixels in the image. This means that the content of this image (output from the genetic algorithm) can be used in many other ways, such as recreating the object with a 3D printer or being analyzed and aggregated with other objects encoded in this “DNA” style. It is like DNA in the sense that DNA encodes 3-dimensional proteins; and these vectors encode the edges in 2-dimensional images.

http://rogeralsing.com/2008/12/07/genetic-programming-evolution-of-mona-lisa/

The image starts out random…

Genetic Programming- Evolution of Mona Lisa - 1

But each attempt is scored against the real image…
Genetic Programming- Evolution of Mona Lisa - 2

The iterative process yields incremental improvements, but sometimes great leaps in progress also appear…
Genetic Programming- Evolution of Mona Lisa - 3

…and viola! Evolution yields the Mona Lisa “code”.

Genetic Programming- Evolution of Mona Lisa - 4

This one clearly produces the best result, and copies the way nature solves problems. Too bad nobody is teaching this in science class yet. You should hire me to teach this at your university. :)


The weekend I audited the world

On Friday, Feb 15, 2013 I attended this interesting talk at the Center for Global Developement, a Washington Think Tank just down the street from GlobalGiving where I work:

Mapping Corruption in Community-Driven Development Projects, a case study in Kenya

Featuring
Jean Ensminger
Edie and Lew Wasserman Professor of Social Science
California Institute of Technology

Hosted by
William Savedoff
Senior Fellow
Center for Global Development

Unlike other people, when I get excited about a good talk, I go home and build tools to exploit the possibilities. Jean Ensminger showed that one can detect fraud within 10,000 pages of World Bank financial reporting using just simple algorithms. The most revealing on is Benford’s Law, which shows that any time people count real objects (money, goats, bribes, etc) they fall into a predictable inverse power law distribution, because you need to count 1 before you can count 2, and so on. The leading digits in real data look like this:

Rozklad_benforda_heuristic_audit

The probability that a number in a financial document starts with a 1 is 30%. 17.6% of numbers will start with a 2, and so on. So I built a tool that can instantly calculate and display a map of this data from any document, along with catching a bunch of other tricks that fraudsters use. Another fraud-prediction trick I especially love is the laziness that humans have in using convenient finger patterns on keypads to enter repetitive data, shown here:

From the fastest way to crack an ATM PIN number:

26.83 percent of passwords can be cracked using the top 20 combinations. These would be 0.2 percent of the passwords if they were randomly distributed:

keyboard_numpadpin code patternsmobile_atm_keypad

Based on this pattern, I have it check for all horizontal, vertical, and diagonal, and corner-zig-zaggy number combinations that make up parts of larger numbers. I also check for frequently repeated numbers, and numbers that look rounded. I left off the pattern of numbers starting with 197x… 198x… 199x… as these are years of birth and specific to passwords, not likely to be part of a pattern someone uses in making up numbers in financial reports.

The crux of why this works is that people try too hard to make fake data look random, when in fact, real data is far less random.

Examples of instant heuristic auditing:

The tools is really simple. Paste a bunch of data from PDF, spread sheet, or word document into the box and hit CHECK. Don’t worry about the text or columns or whatever – the algorithm will ignore everything but the numbers:

Plop-n-test heuristic auditing

CAVEAT: Jean Ensminger was careful to point out that this approach is only a diagnostic tool, and not proof of fraud. Furthermore, only invoices and other spreadsheets of the day-to-day expenses will conform to Benford’s Law, and not summaries of these, or expenses that are arbitrarily constrained (see below).

Kenya’s Constituencies Development Fund (40,693 CDF projects)

Kenya’s politicians all get a legal pork fund from which they fund local projects. Accusations of double-dipping are rampant, but are they true?

And the Result? The flattened 1s and 2s look bad, but we can’t say it is fraud. It turns out that these 40,000 CDF line items are constrained by the allowances each member of parliament gets. I’ve been told to expect this kind of flattened distribution when expenses are constrained, and you can read more on why more here.

CDF heuristic audit (total 40693 records 2003-2010)

What this does reveal is that 200,000 and 300,000 are among the most common numbers, representing 39% and 30% of all line items respectively. At the very least, this is some very lazy reporting as Kenyan MPs allocated the maximum to projects instead of breaking it up to serve many more needs. This fund represented $14 billion of Kenyan’s public budget in 2011.

My source is Kenya’s OpenData Project: https://opendata.go.ke/Public-Finance/CDF-Projects-2003-2010/6rxd-cfvr 

Kenya School statistics (31,230 schools)

I also pasted all data for all secondary school statistics into the djotjog instant heuristic auditor:

Pupil Teacher Ratio Pupil Classroom Ratio Pupil Toilet Ratio Total Number of Classrooms Boys Toilets Girls Toilets Teachers Toilets
Total Toilets Total Boys Total Girls Total Enrolment GOK TSC Male GOK TSC Female Local Authority Male
Local Authority Female PTA BOG Male PTA BOG Female Others Male Others Female Non-Teaching Staff Male Non-Teaching Staff Female

And the results look much better!

Kenya schools statistics heuristic audit N=31230

Let me walk through this example, because it represents a huge volume of data (31,230 schools):

  • The top five most common numbers are 0,1,2,3,4 – which is to be expected from real data. In fact, half of all numbers are zeroes. I guess reported school enrollment is not very high, but at least the numbers don’t lie.
  • Very few of the numbers appear to be estimated, keypad-biased, or duplicates.
  • Less than 1% of numbers are repeated.
  • The total deviation is the sum of the absolute differences between the ideal and actual frequencies for each digit. Seems like scores around 20-30 are typical of the financial documents I tested, and this comes in with a score of 15 – lower is better.
  • I realized I pasted some columns that are percents instead of raw numbers. This data does not conform to Benford’s law, so the actual raw numbers on school enrollment are probably even better.

Invoices for the GlobalGiving Storytelling Project:

Transparency starts at home, eh?

Here is an invoice from Moses, our Ugandan story coordinator from 2011-2012. He checks out okay.

Moses-invoiceAnd here are all 7 of my invoices for the storytelling project in 2011. They check out as well. (phew!)

Marc-all-2011-invoices-storytelling-heuristic-audit

Note to self: I could tell from the numbers that my algorithm is pulling out that ti was breaking up numbers like 11,452 and 5,523 into two numbers. I’ve fixed that now on http://djotjog.com/audit/.

Auditing random GlobalGiving Projects

Below are 5 organizations that applied to join GlobalGiving. Two of these were detected a suspicious (disreputable) organizations and possible frauds. The other three are current partner organizations. I think you can tell which of these five has a clearly deceptive accounting trick in play. Note that in this case I am looking at the actual amounts an organization claims to have spent on various expenses in a year, and not their projected future budgets.

DD-4 DD-2 DD-3 DD-4-big-intl-aid-990-form KMET

Implications of heuristic auditing for the world:

  1. Real time diagnostics – while it can’t prove fraud, it tell you if something is fishy before you pay an invoice.
  2. These heuristic audits took less than 2 minutes each – 1 minute to find the data online, 10 seconds for the python algorithm to run, and 50 seconds to paste a screen shot into this blog post.
  3. Instant bullshit-detection can allow program managers to screen financial data in real time, thereby avoiding paying out money at the first sign of a red-flag.
  4. Open financial data is now instantly actionable. It took the Kenya OpenData Project months to get this data public (Thanks for Eric Hersman and other advocates), but mostly it just sat there in a large obscure spreadsheet. Now, the larger the data set, the more reliable the audit.
  5. Concise reporting is safer: This inverts the traditional “bury ‘em with data” strategy to avoiding getting caught. It is much harder to fake a large report, because computers can find patterns without reading the data itself.
  6. Citizens have the power to detect corruption on a large scale. If given 500 financial documents, we can screen them all in a weekend.
  7. The good guys have more power within institutions to stamp out fraud. According to Jean Ensminger, the World Bank’s INT (Integrity Vice Presidency) has had only four trained forensic accountants on staff at any given time in recent years. These are the people who can do this kind of audit (the old fashioned way), but they only audit projects that have a “credible complaint and suspicion of corruption” – which is only a small fraction of all the billions of dollars that the World Bank disburses each year. This tool can help every part of the World Bank (and GlobalGiving) catch fraud on a small scale before it gets to be as rampant as that seen in the Arid Lands Project.
  8. Soon I’ll publish an analogous version that does this with language, narratives, and “qualitative” reports. I’ve been working on it for 6 months but we’re close to being able to launch the first version for public use. I’ve described a preliminary version here.
  9. Context becomes important after you see a suspicious pattern: There are legitimate reasons why anomalies occur in datasets, so it helps to ask more questions. This information is dangerous (undermines the credibility of people who fight corruption) when others who don’t understand how the tool works try to apply it out of context:

Example: Are principals lying when they report the number of classrooms in their schools in Kenya?

school classrooms in kenya

Here the Benford analysis is correctly applied to this statistic, and N is large (over 31,230 primary schools), and yet the distribution shows a preponderance of just a few numbers: 8, 9, 12, and 16.

The context here matters. Why do 28% of all primary school appear to have a reported 8 classrooms? Because classroom blocks are built to house an even number of classrooms, and the most common design features 8 classrooms. The same applies to schools with 12 and 16 classrooms. What’s truly surprising is the high frequency of 9 classroom schools. It might be because schools run from grade 1 to 9, or because an 8 classroom school is overpopulated and has set up a ninth “makeshift” classroom. Context matters. But numbers do too.

Now, project managers, go forth and audit yourself. Your proactive vigilance can make corruption harder to get away with.

stop-corruption

The tool is free – just use it! Click on the image to load it.

Postscript:

Since I posted this, the World Bank hosted a DataKind Hackathon where we improved the tool. Here is a presentation about it:

And my follow up post to this: Turning victims of fraud into agents of change

reporter_pen grandmother_school_kids

Follow

Get every new post delivered to your Inbox.

Join 669 other followers